 |
 |
 |
 |
 |
 |
 |
sparkledesign |
|
user interface web sites branding & identity research & usability stationary & brochures experimental |
| tide chart |
innovation |
|
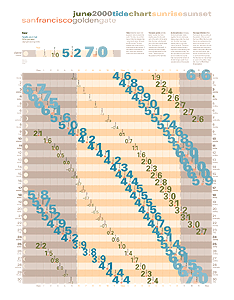
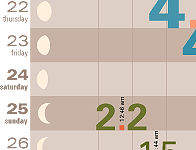
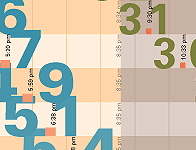
| statistical design In this tide diagram, rather than merely graphing the height of the tide, a relationship can be seen between the time of day and the tides. The data is used as a design element - type size indicates tide height. The poster provides an interesting "at a glance" view, while each day is readable as an element of data. |
tide chart poster |
|
 |
||


